Employee Survey Benchmarks:
Understanding Employee Engagement Scores
Employee engagement survey results are typically presented in two ways - as raw scores and as benchmark scores.
Raw Scores are simply the average of all responses. Survey questions that measure employee satisfaction or engagement usually use a 5-point rating scale, where the lowest possible raw score is a 1, and the highest possible raw score is a 5.
By themselves, raw scores don't tell you whether a score is high or low. How people respond to a survey question depends on how the question is worded and the topic the survey item is addressing. Thus, when looking at employee satisfaction or engagement survey results, you can't draw conclusions about levels of satisfaction or engagement by just looking at raw scores. If you want to know whether a score is good or bad, you need a way to calibrate your scores. This is done by comparing your results to the scores received by other organizations. In other words, you need some way to benchmark your survey results. (see the importance of benchmark data for more on this topic)
Employee Engagement Survey Benchmark Data
A benchmark score is a numeric score that compares your engagement score to the engagement scores in other organizations. There are various types of benchmark scores. Each uses a different methodology and has its own defined numeric range of possible values. The most common types of benchmark scores used on employee surveys are T-scores and percentiles.
T-Scores are one way of representing benchmark scores. Like all benchmarking methods, T-Scores eliminate the natural variations between survey questions and provide a way to determine whether scores are high or low.
T-Scores tell you how your scores compare to the scores received by other organizations. They provide a quick and easy way to see how your score compares to the average employee engagement score across organizations and sectors.
What is a good employee engagement score?
We can't say exactly what a "good" engagement score is because standards for "good" differ from one organization to the next. However, with benchmark scores, we can talk about whether scores are below average or above average - after all, that's what benchmarking is all about.
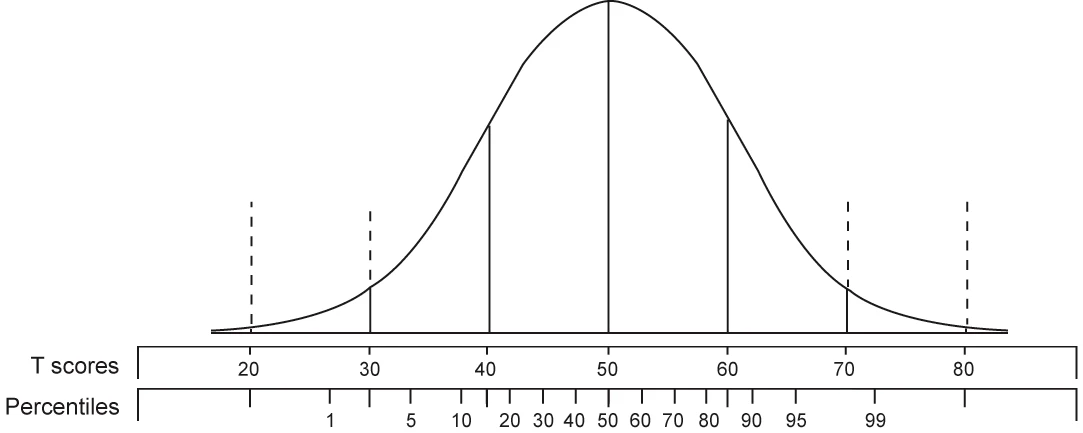
When using T-Scores, the mean (average) score is 50, and the standard deviation is 10. If your T-Score is above 50, then it is above average. If your score is less than 50, it is below average. For example, if you have a T-Score of 60, you scored higher than 84% of all organizations.
T-Scores are distributed in a bell-shaped curve, as illustrated above. 68% of T-Scores fall between 40 and 60. 96% of scores fall between 30 and 70. Only 4% of scores fall below 30 or above 70. This means T-scores fall within a narrower range than percentile scores. The scales below the bell curve show how T-scores compare to percentile scores.
In order to calculate T-Scores, we need to start with good normative (benchmark) data. This is obtained by collecting survey responses from employees at hundreds of different organizations. We then calculate the average (mean) and the standard deviation of the scores for each survey question across all those organizations. (Standard deviation is a measure of variation. It indicates how much scores vary across different organizations.)
Employee engagement score formula:To calculate a T-Score, we take your organization's raw score minus the normative mean (average across all organizations) and divide by the standard deviation. Lastly, we multiply by 10 and add 50. (These last steps simply transform the score into a range that is more intuitive. If we omit these last steps, the score is referred to as a z-score, with an average of zero and a standard deviation of 1.)
T-Score = |
(Your Score - Benchmark Average Score) Benchmark Standard Deviation | 10 + 50 |
Examples of T-Score Calculations

| Sample survey question: "Employee satisfaction is a priority in this company."
Your organization's raw score: 4.2 (for example) Average score across all organizations: 3.7 Standard deviation across all organizations: 0.5 T-Score = (4.2 - 3.7) / 0.5 * 10 + 50 = 60 |

| Sample survey question: "Employee satisfaction is the top priority in this company."
Your organization's raw score: 3.6 (for example) Average score across all organizations: 3.1 Standard deviation across all organizations: 0.5 T-Score = (3.6 - 3.1) / 0.5 * 10 + 50 = 60 |
These examples illustrate how benchmark scores provide essential context to raw scores. The two sample survey questions are worded differently, which influences how people respond to them. Notice how the raw scores are very different but lead to identical T-Scores.
Why and how does benchmarking work?
When we look at engagement or satisfaction survey results across a large number of different organizations, we find that scores on survey questions tend to follow a normal distribution. This means that scores follow a fairly predictable bell-curve pattern.
The chart below is an example of how different companies scored on a survey question that measures employee satisfaction.
The vertical axis indicates the number of companies, and the horizontal axis indicates the score. For example, 20 companies received a score of 3.1.
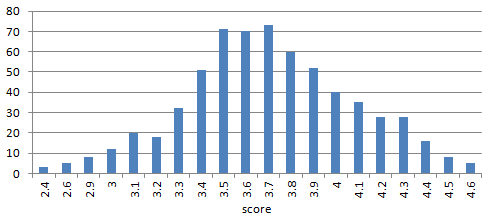
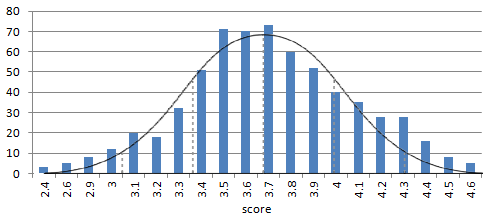
This bell-curve shape means the responses to this survey question are "normally distributed". Since the responses are normally distributed, we can use benchmark scores to describe how high or low any particular company's score is compared to other companies.
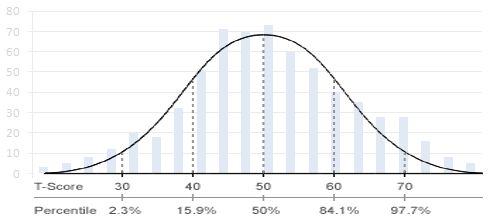
T-Scores are not the only way to describe how high or low a score is. Perhaps the most popular way to represent benchmark scores in employee surveys is with percentiles. Percentile scores tells you what percent of organizations scored lower than your organization. Percentile scores range from 1 (low) to 99 (high). The bell curve chart above includes both T-Scores and Percentiles so you can see how T-Scores compare to percentile scores.
After the Survey
Once your organization has conducted an employee survey and received the results, we recommend HR and organization leaders follow this strategic post-survey protocol: